Balance of the Assessment
Balance of the Assessment
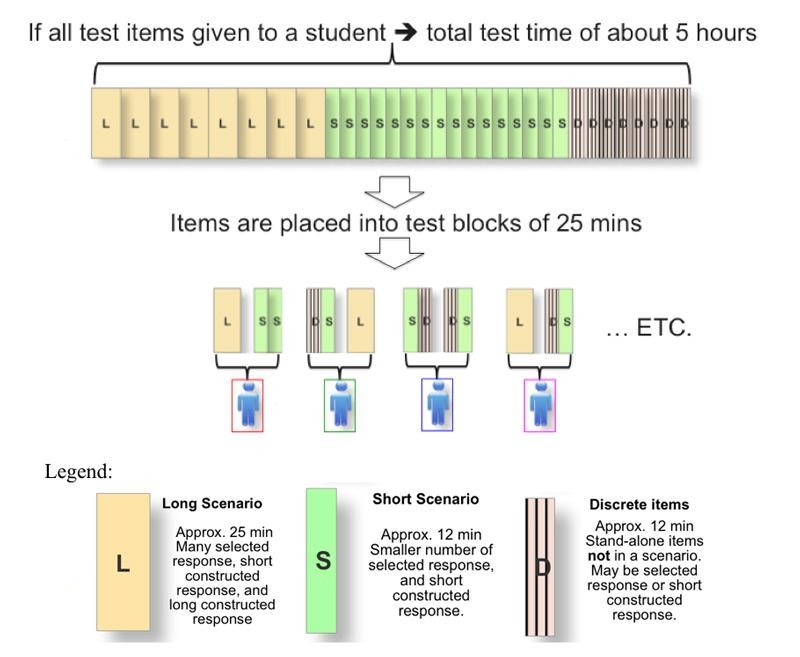
To ensure an appropriate distribution of the test time, it is important to balance the different components of the assessment. This section discusses how this can be done. Note that "total test time" refers to the length of time that it would take to administer all available assessment blocks (see figure 3), which is the equivalent of approximately 5 hours of test time. Many students will be in the sample population during each administration of the test, but each of these students will spend approximately 50 minutes on the assessment tasks, so there must be a plan for distributing each assessment block to many students. Figure 3 also shows a simple example of how assessment types might be grouped together.
This section discusses four separate aspects of the assessment that should be considered in determining an overall balance:
The balance required at each grade level is specified in the following sections as a percentage of the total test time. In other words, the percentage expresses what proportion of the total amount of testing time—as represented in the total item pool shown at the top of the diagram in table 4.1—would be allocated. Since a student is assigned to take only one of the groups of item sets shown in Table 4.1, the percentages do not necessarily represent the distribution of time in any single student's test session. It should also be noted that the percentage of testing time distributions shown in tables 4.1 through 4.4 are to be regarded as targets, and it is understood that percentages in the actual assessment may vary slightly from the target percentages.
The balances shown in the following tables 4.1 through 4.4 were determined after careful consideration and deliberation by both the planning committee and the steering committee members. They reflect the expert judgment of the committees after they took into account how the knowledge and skills in the area of technology and engineering literacy are taught at different grade levels and how they develop over time. The percentages shown in the tables were derived from a process in which planning committee members made individual judgments, the group results were tabulated, and then discussion followed to come to a consensus that is represented in tables 4.1 through 4.4.
Assessment Balance by Major Assessment Area
Table 4.1 shows the balance by major assessment area at each of the 3 grade levels. At fourth grade there is an emphasis on ICT because the focus of technology and engineering literacy instruction at that grade is on using common information and communication technologies. At eighth grade the balance is weighted to Design and Systems because in middle school there is more emphasis on systems, and there is slightly less time spent on ICT than in the early grades. At 12th grade the balance is slightly weighted to Design and Systems and to ICT.
Table 4.1 Assessment balance by major assessment areas and grade
Major Assessment Area |
Grade 4 |
Grade 8 |
Grade 12 |
|---|---|---|---|
25 |
25 |
30 |
|
30 |
40 |
35 |
|
45 |
35 |
35 |
Assessment Balance by Practice
The balance of the assessment by crosscutting practices across the 3 grades levels is shown in table 4.2. At all grades the balance of total test time is as follows:
- Understanding Technological Principles – 30 percent
- Developing Solutions and Achieving Goals – 40percent
- Communicating and Collaborating – 30percent
The rationale for a slight emphasis on the practice of Developing Solutions and Achieving Goals is that it is important for students to be able to use their knowledge of technological principles in developing solutions to problems.
Table 4.2 Assessment balance by practices and grades
Practice |
Grade 4 |
Grade 8 |
Grade 12 |
|---|---|---|---|
30 |
30 |
30 |
|
40 |
40 |
40 |
|
30 |
30 |
30 |
Assessment Balance by Set Type
In addition to ensuring a balance across the content of the assessment, table 4.3 specifies how the total amount of testing time should be balanced across the 3 types of assessment sets—long scenario, short scenario, and discrete item sets. There is an emphasis on the scenarios because they allow for a wide range of interactive tasks that are well suited to assessing the types of practices that students need to apply in practical investigations. The 20 percent of discrete items allow for more independent testing of knowledge and skills that help to maintain test reliability.
Table 4.3 Assessment balance by set types and grades
Set Type |
Grade 4 |
Grade 8 |
Grade 12 |
|---|---|---|---|
Long Scenarios |
40 |
40 |
40 |
Short Scenarios |
40 |
40 |
40 |
Discrete items |
20 |
20 |
20 |
Assessment Balance by Response Type
Table 4.4 specifies the balance of assessment response types across the total testing time. Across all grade levels, there will be an emphasis on constructed response items because the more complex tasks involved in scenarios demand that students are involved in activities that create products rather than simply select among choices of responses. Since the balance of types of assessment types specified in table 4.3 is weighted toward scenarios, there is a corresponding weighting toward constructed responses, although selected responses also form an important part of the assessment.
Table 4.4 Assessment balance by response types and grades
Grade Response Type |
Grade 4 |
Grade 8 |
Grade 12 |
|---|---|---|---|
40 |
40 |
40 |
|
60 |
60 |
60 |